Usage
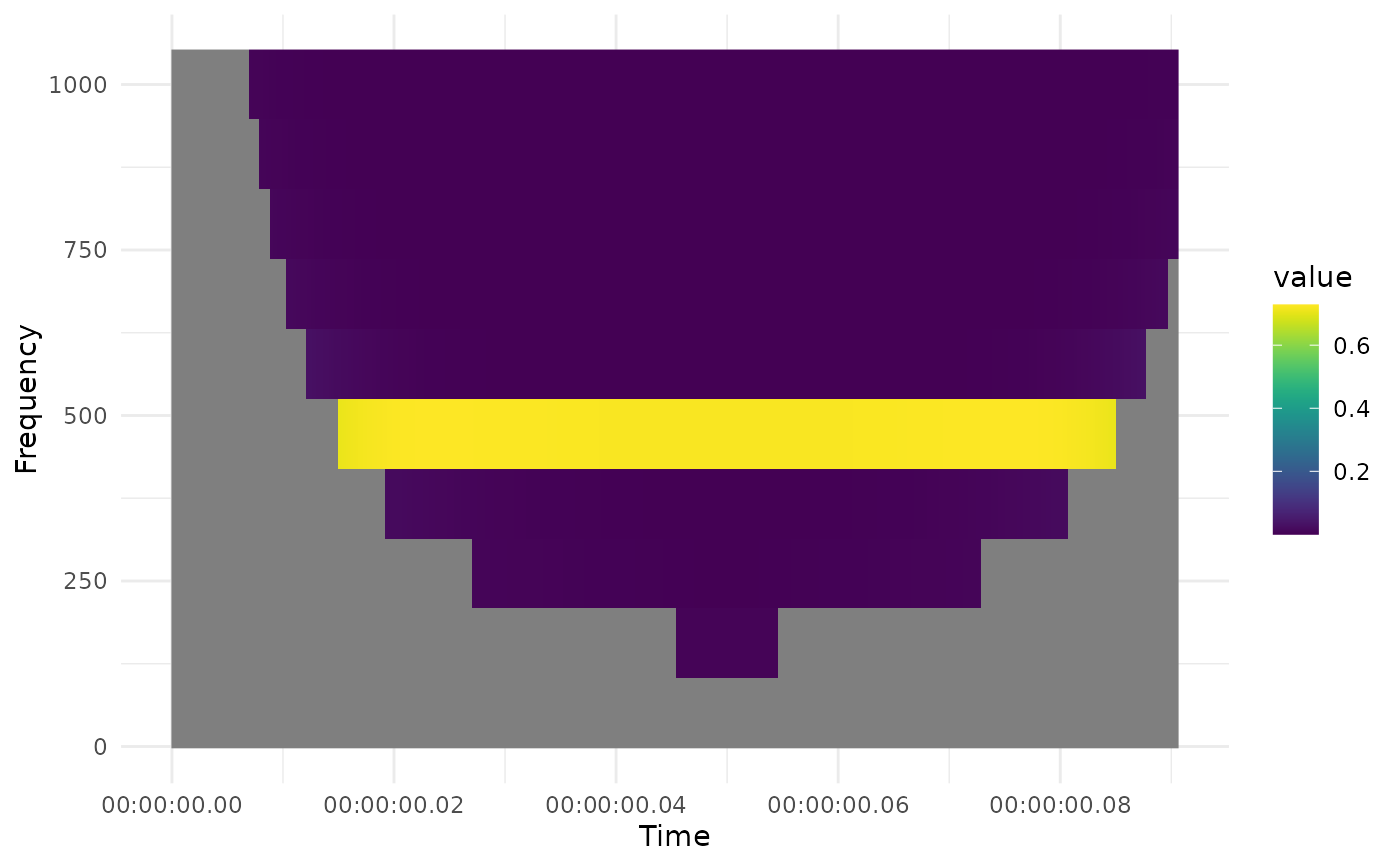
# S3 method for class 'fcwtr_scalogram'
plot(x, n = 1000, time_unit = "s", freq_unit = "Hz", transf = identity, ...)
Arguments
- x
An "fcwtr_scalogram" object resulting from
fcwt().- n
The plotting function reduces the time resolution by averaging to generate a reasonable graphics format.
nis the number of time steps that are plotted. Defaults ton = 1000.- time_unit
A time unit that is used for the x-axis scale. Default to "s" - seconds. See
units::valid_udunits()andunits::valid_udunits_prefixes()for valid expressions.- freq_unit
A frequency unit that is used for the y-axis scale. Defaults to "Hz" - "Hertz". See
units::valid_udunits()andunits::valid_udunits_prefixes()for valid expressions.- transf
A function, taking a vector and returning a vector, that is used to transform the scalogram values before plotting.
- ...
other arguments passed to specific methods