heumilkr provides an implementation of the Clarke-Wright algorithm (Clarke and Wright 1964) to find a quasi-optimal solution to the Capacitated Vehicle Routing Problem. It is available as an R package and as a Python package, which share the same C++ core.
Besides deliveries, it also supports “backhaul”: sites with negative demand have goods picked up and brought back to the depot, in any order within a run as long as the load stays within the vehicle capacity.
For a fixed number of vehicle types, the run time grows at best quadratically and at worst cubically with the number of sites . On the problems we tested with randomly placed sites and up to 4000 sites, it grew roughly like to , and roughly like if a limited vehicle type repeatedly runs out (see Runtime Benchmarks).
Installation
R
You can install the latest CRAN release of heumilkr with:
install.packages("heumilkr")Alternatively, you can install the development version of heumilkr from GitHub with:
# install.packages("devtools")
devtools::install_github("lschneiderbauer/heumilkr")
Python
You can install the latest PyPI release of heumilkr with:
Alternatively, you can install the development version of heumilkr from GitHub, which requires a C++ compiler, with:
The only dependency is NumPy. Install heumilkr[pandas] to also get pandas for Solution.to_pandas().
Example
R
The following example generates random demands at random locations, defines two vehicle types, applies the Clarke-Wright algorithm to generate quasi-optimal vehicle runs, and shows the resulting vehicle run solution.
library(heumilkr)
set.seed(42)

# generating random demand
demand <- runif(20, 5, 15)

# generating random site positions
positions <-
  data.frame(
    pos_x = c(0, runif(length(demand), -10, 10)),
    pos_y = c(0, runif(length(demand), -10, 10))
  )

solution <-
  clarke_wright(
    demand,
    dist(positions),
    # We have an infinite number of vehicles with capacity 33 available,
    # and two vehicles with capacity 44.
    data.frame(n = c(NA_integer_, 2L), caps = c(33, 44))
  )

print(solution)
#> $runs
#>   run vehicle max_load  distance
#> 1   0       0 25.78821 16.929475
#> 2   1       0 31.75943 29.029139
#> 3   2       1 34.12677 20.601801
#> 4   3       1 41.60558 30.176394
#> 5   4       0 22.65398 14.329082
#> 6   5       0 21.76854 14.231704
#> 7   6       0 14.34672  6.043174
#> 8   7       0 30.58007 36.895550
#>
#> $sites
#>    site    demand
#> 1     0 14.148060
#> 2     1 14.370754
#> 3     2  7.861395
#> 4     3 13.304476
#> 5     4 11.417455
#> 6     5 10.190959
#> 7     6 12.365883
#> 8     7  6.346666
#> 9     8 11.569923
#> 10    9 12.050648
#> 11   10  9.577418
#> 12   11 12.191123
#> 13   12 14.346722
#> 14   13  7.554288
#> 15   14  9.622928
#> 16   15 14.400145
#> 17   16 14.782264
#> 18   17  6.174874
#> 19   18  9.749971
#> 20   19 10.603327
#>
#> $visits
#>    run site order      load
#> 1    1    0     2  0.000000
#> 2    0    1     0 11.417455
#> 3    1    2     0 23.898031
#> 4    3    3     1 21.954433
#> 5    0    4     1  0.000000
#> 6    2    5     0 23.935806
#> 7    2    6     2  0.000000
#> 8    3    7     0 35.258910
#> 9    2    8     1 12.365883
#> 10   4    9     0 10.603327
#> 11   5   10     0 12.191123
#> 12   5   11     1  0.000000
#> 13   6   12     0  0.000000
#> 14   3   13     3  0.000000
#> 15   7   14     1  6.174874
#> 16   3   15     2  7.554288
#> 17   7   16     0 15.797802
#> 18   7   17     2  0.000000
#> 19   1   18     1 14.148060
#> 20   4   19     1  0.000000

# returns the total cost / distance
# (the quantity that is minimized by CVRP)
print(milkr_cost(solution))
#> [1] 168.2363

# returns the savings resulting from the heuristic optimization procedure
print(milkr_saving(solution))
#> [1] 168.7352
The R package has a built-in plotting function (using ggplot) for the result. The individual runs are distinguished by color. The site locations are marked with round circles while the depot is depicted as a square. The line types (solid/dashed/…) are associated to different vehicle types.
plot(solution)
Python
The following example solves a small problem with a fixed set of demands and distances, applies the Clarke-Wright algorithm to generate quasi-optimal vehicle runs, and shows the resulting vehicle run solution.
import heumilkr as hm

solution = hm.clarke_wright(
    demand=[3, 2, 4, 2],
    # distances between all locations, the first one is the depot
    distances=[
        [0, 1, 1, 2, 3],
        [1, 0, 2, 1, 2],
        [1, 2, 0, 3, 4],
        [2, 1, 3, 0, 1],
        [3, 2, 4, 1, 0],
    ],
    # one vehicle with capacity 6, and an unlimited number with capacity 9
    vehicles=[hm.Vehicle(capacity=6, count=1), hm.Vehicle(capacity=9)],
)

for run in solution.runs:
    print(run)
#> Run(id=0, vehicle=1, sites=(0, 2, 3), loads=(6.0, 2.0, 0.0), distance=6.0, max_load=9.0)
#> Run(id=1, vehicle=0, sites=(1,), loads=(0.0,), distance=2.0, max_load=2.0)

# returns the total cost / distance
# (the quantity that is minimized by CVRP)
print(solution.cost())
#> 8.0

# returns the savings resulting from the heuristic optimization procedure
print(solution.saving())
#> 6.0
How the Algorithm Works
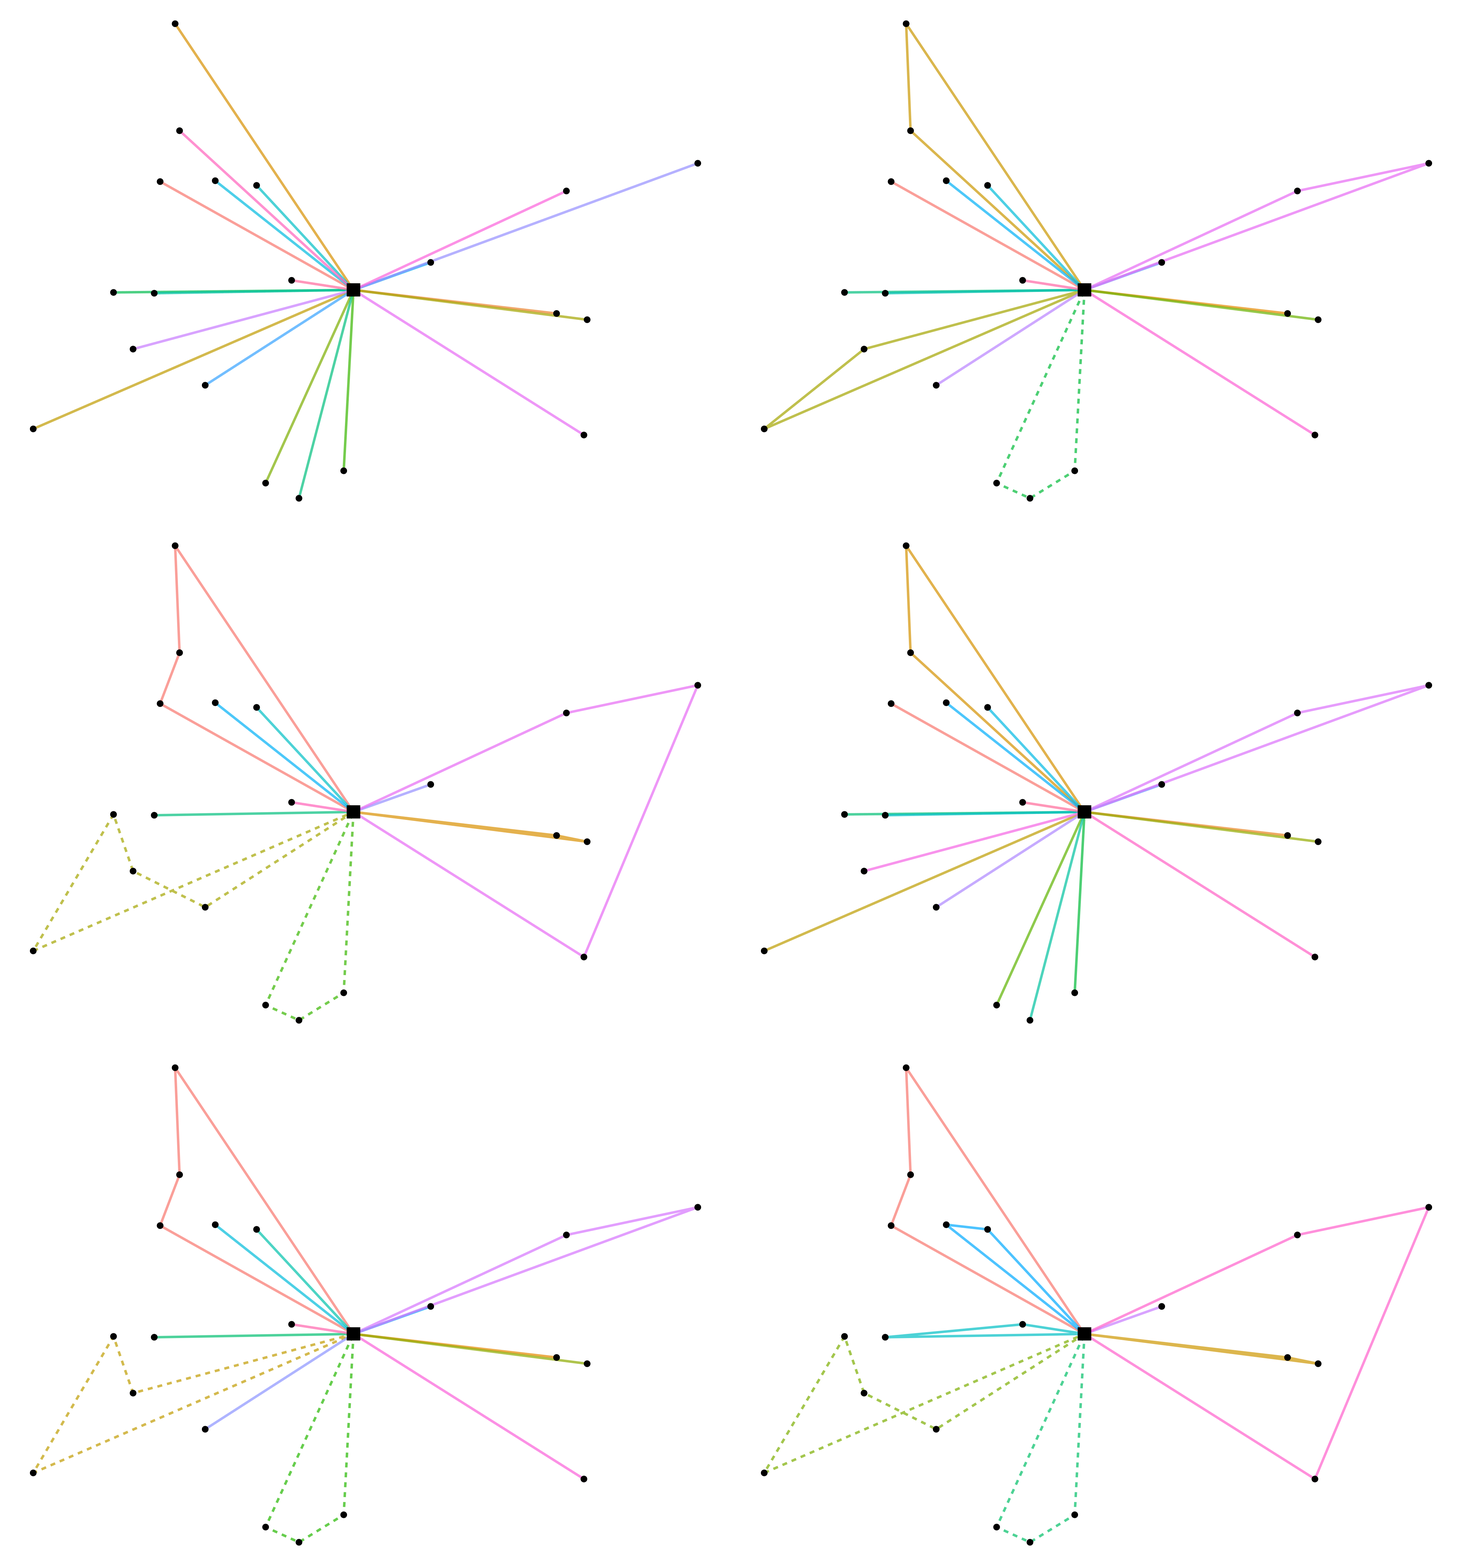
The following animation, made with the R package, shows how the Clarke-Wright algorithm iterates to arrive at its final solution:
Runtime Benchmarks
The benchmarks were taken on an Intel® Xeon® CPU E3-1231 v3 @ 3.40GHz CPU, through the R package using bench. The solver itself is the same C++ code in Python, but converting inputs and results adds some overhead that differs between the two packages.
The following graph shows the run time on one kind of problem: uniformly distributed random sites, demands between 5 and 15 and a vehicle capacity of 33. It amounts to for , for , and for . Run times can differ for other problems.

Documentation
The two packages have separate documentation sites:
- R package: website with the function reference and the articles.
- Python package: API reference.
Feature Differences
Both packages include the solver with all its options (backhaul, vehicle types and restrictions) and calculate the cost and savings of a solution. The following is only part of the R package:
- plotting a solution,
- downloading and solving CVRPLIB instances,
- the performance vignette, although its results also apply to the Python package, since they measure the shared solver.